Maps of Wiltshire

WILTONIAE
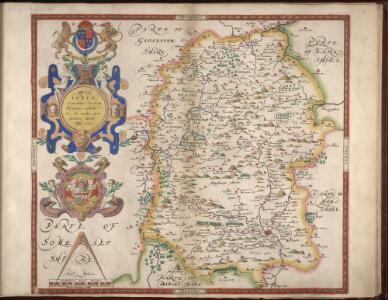
This map of Wiltshire is from the 1583 edition of the Saxton atlas of England and Wales. TThis atlas was first published as a whole in 1579. It consists of 35 coloured maps depicting the counties of England and Wales. The atlas is of great significance to British cartography as it set a standard of cartographic representation in Britain and the maps remained the basis for English county mapping, with few exceptions, until after 1750. During the reign of Elizabeth I map use became more common, with many government matters referring to increasingly accurate maps with consistent scales and symbols, made possible by advances in surveying techniques. Illustrating the increasing used of maps in government matters, Lord Burghley, Elizabeth I’s Secretary of State, who had been determined to have England and Wales mapped in detail from the 1550s, selected the cartographer Christopher Saxton to produce a detailed and consistent survey of the country. The financier of the project was Thomas Seckford Master of Requests at the Court of Elizabeth I, whose arms appear, along with the royal crest, on each map. Saxton’s name appears in the decorative scale bar as does the name of the engraver of this map, Remigius Hogenberg ,one of seven English and Flemish engravers employed to produced the copper plates for the atlas. Relief, in the form of uniform rounded representations of hills, is the main topographical feature presented in the maps. Rather than provide a scientific representation of relative relief these give a general impression of the lie of the land. Settlements and notable buildings are also recorded pictorially; a small building with a spire represents a village, while more important towns are indicated by groups of buildings. Here Stonehenge is marked by a pictorial representation and named The Stonadge’. Saxton, Christopher Ryther, Augustine
Wiltonia sive Comitatus Wiltoniensis; Anglis Wil Shire. [Karte], in: Theatrum orbis terrarum, sive, Atlas novus, Bd. 4, S. 163.
1 Karte aus Atlas Blaeu, Joan Blaeu, Willem Janszoon
Wiltonia sive Comitatus Wiltoniensis; Anglis Wilshire. [Karte], in: Le théâtre du monde, ou, Nouvel atlas contenant les chartes et descriptions de tous les païs de la terre, Bd. 4, S. 145.
1 Karte aus Atlas Blaeu, Willem Janszoon und Blaeu, Joan Blaeu, Willem Janszoon
Wiltonia sive Comitatus Wiltoniensis; Anglis Wil Shire. [Karte], in: Theatrum orbis terrarum, sive, Atlas novus, Bd. 4, S. 163.
1 Karte aus Atlas Blaeu, Joan Blaeu, Willem Janszoon
Wiltonia sive Comitatus Wiltoniensis. Anglis Wil Shire. [Karte], in: Novus atlas absolutissimus, Bd. 7, S. 170.
1 Karte aus Atlas Janssonius Offizin
WILTONIAE Comitatus
This is a map of Wiltshire by Christopher Saxton which dates from 1576. It forms part of an atlas that belonged to William Cecil Lord Burghley, Elizabeth I’s Secretary of State. Burghley used this atlas to illustrate domestic matters. This map is actually a proof copy of one which forms part of Christopher Saxton’s Atlas of England and Wales. This atlas was first published as a whole in 1579. It consists of 35 coloured maps depicting the counties of England and Wales. The atlas is of great significance to British cartography as it set a standard of cartographic representation in Britain and the maps remained the basis for English county mapping, with few exceptions, until after 1750. During the reign of Elizabeth I, map use became more common, with many government matters referring to increasingly accurate maps with consistent scales and symbols, made possible by advances in surveying techniques. Illustrating the increasing use of maps in government matters, Lord Burghley, who had been determined to have England and Wales mapped in detail from the 1550s, selected the cartographer Christopher Saxton to produce a detailed and consistent survey of the country. The financier of the project was Thomas Seckford Master of Requests at the Court of Elizabeth I, whose arms appear, along with the royal crest on each map .Lord Burghley has added several place names to the map. This map was engraved by Remigius Hogenbergius, one of a team of seven English and Flemish engravers employed to produce the copper plates for the atlas. Saxton, Christopher Hogenbergius, Remigius

Wiltonia sive Comitatus Wiltoniensis anglis Wil Shire
1 : 210000 Amstelodami : apud Joannem Janssonium
WILTONIA | sive | COMITATVS WILTONI- | ENSIS; Anglis | WIL SHIRE.
[Amsterdam : Joan Blaeu]
An improved map of Wilt Shire
1 Karte : Kupferdruck ; 52 x 68 cm Bowen; Tinney sold by I. Tinney at the Golden Lion in Fleet street
Wiltonia sive comitatvs Wiltoniensis; anglis Wil Shire
1 Karte : Kupferdruck ; 40 x 48 cm Blaeu Joan Blaeu
Cary's Improved Map of England and Wales
Cary, George, & Cary, John London : G. & J. Cary
Frome - OS One-Inch Map
1 : 63360 Topographic maps Ordnance Survey Ordnance Survey
Salisbury - OS One-Inch Map
1 : 63360 Topographic maps Ordnance Survey Ordnance Survey
Bath & Bristol, Sheet 28 - Bartholomew's "Half Inch to the Mile Maps" of England & Wales
1 : 126720 Topographic maps Bartholomew, John George John Bartholomew & Co
Swindon - OS One-Inch Map
1 : 63360 Topographic maps Ordnance Survey Ordnance Survey
Bristol and Stroud - OS One-Inch Map
1 : 63360 Topographic maps Ordnance Survey Ordnance Survey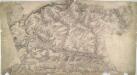
Warminster
1 : 31680 Although this drawing was surveyed six years before the obligatory inclusion of archaeological sites on drawings, several are featured. The most famous of these is Stonehenge, to the right of the drawing. Ancient camps, earthworks, castles and grave mounds ('tumuli') pepper the area, indicated by concentric shapes and a title in neat script. Their inclusion reveals the meticulous nature of the survey. To the right of the drawing, opposite Wishford, a trigonometrical station is indicated by a dot within a circle (annotated 'Col. Mudge's station' - Major-General William Mudge was Superintendent of the Ordnance Survey). This station denotes a point from which angular measurements were taken. In the right hand margin of the drawing a point titled "End of Base" marks the end of the Salisbury Plain baseline: an important measurement allowing for the triangulation of the area. Crocker, Edmund
Frome
This drawing highlights Bath and the River Avon. Major communication routes are coloured yellow/buff, according to military cartographic convention. Shading and 'hachuring' denote relief and give an overall impression of the undulating landscape. The Somerset Coal Canal is clearly visible leading into Bath. It was established by Act of Parliament in 1794 and welcomed by the mine owners of north Somerset as a cheaper way of transporting coal to Bath and the surrounding areas, curbing fears of an influx of Welsh coal. The canal was one of the most successful in the country, carrying over 100,000 tons of coal per year. That success was to be checked, however, by the expansion of the local rail network, in particular, the opening of the line between Radstock and Frome, which hastened the canal's closure in 1898. At the time of this survey, the canal was fully operational. Crocker, Edmund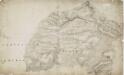
Malmesbury
1 : 31680 This drawing covers the counties of Gloucestershire and Wiltshire, with their boundary indicated by a pecked line. The Wiltshire and Berkshire Canal is shown. Individual locks are indicated by breaks in the blue watercolour line. The Roman road from Bath to Cirencester is marked, and "Ancient Entrenchments" are noted nearby, represented by tiny outline plans of their structure. Crocker, Edmund
Bradford, Wiltshire
The small pencil markings at the edges of this drawing were used as reference points by the draughtsman from which to plot the area accurately. The road to Earl Stoke is marked "TG", meaning toll gate. The precision with which the survey records the road network is testimony to the military imperative of the Survey and is a major advance on earlier county maps. Running diagonally across the drawing is the Roman road from Bath, indicated by grey lines. The Kennet and Avon Canal and the Wiltshire and Berkshire Canal are shown in aquamarine, with each lock recorded, most notably on the section leading into Devizes. The canals were opened in 1810 to better exploit the resources of the Somerset coalfield, and are therefore contemporary with the survey of this drawing. The paper is watermarked JAMES WHATMAN TURKEY MILL KENT 1807.
Swindon
1 : 31680 The author of this drawing, William Stanley, was listed as a 'first class' Military draughtsman and surveyor at the Tower of London Drawing Room. His elaborate hill shading technique for describing relief and the attention he pays to communications routes reinforce the military emphasis of these maps. Archaeological details are documented even though this did not become obligatory until 1816. The iron-age hillfort at Barbury Castle is described, along with numerous barrows and earthworks. Stanley, William
Berwick St. John
Small red crosses at Baverstoke, at the top centre, and Et Knoyle, at the top left,mark observation points used by the surveyor to plot topographical details and measure distances. The draughtsman has faithfully recorded the relative relief of the hills and indicated areas of woodland, using various shades of green to distinguish woods from grassland. The ancient circular earthworks of Chiselbury are marked by concentric rings on White Sheet Hill, in the centre of the drawing.
Chipping Sodbury
1 : 31680 The Avon barracks and battery are documented at the mouth of the River Severn, at the top of the map, protecting the Bristol Channel. Gravemounds ('Tumuli'), hill forts, ancient camps and antiquities are distinguished by the use of gothic lettering. The recording of archaeological details became obligatory in 1816. Quarries, kilns, mills, brickyards and pits dominate this industrial region of the West Midlands. According to a note in the Ordnance Survey Day Books, held in the National Archives, a one inch-to-the-mile reduction of this plan was delivered to Captain Gossett for engraving in the Drawing Office at the Tower of London in March 1830. Crocker, Edmund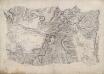
Wincanton
This drawing is rich in archaeological sites, the most notable being Cadbury Castle, which, according to legend, is the Camelot of Arthurian myth. It is marked by several concentric rings inside a band of dense shading, smudged at the top, indicating a steep mound. It was not until 1839-40 that contour lines were introduced into Ordnance Survey drawings, and so the two large blank areas on the map represent low fluvial tracts. Red pecked lines denote the boundaries between Dorset, Somerset and Wiltshire
Salisbury
1 : 31680 This drawing is rich in archaeological sites, among them the prehistoric monument known as Stonehenge. Situated on Salisbury Plain, it is the most celebrated megaithic monument in England. The iron-age hillfort of Old Sarum is also marked. A castle and cathedral were built on its earthworks during the 12th century, but abandoned when a new cathedral was built a mile and a half away - the foundation of the modern city of Salisbury. The red line extending from Old Sarum to Beacon Hill is the baseline for the triangulation of the area. Several other archaeological sites are marked: the iron-age hillforts at Vispasians Camp, Ogbury Camp and Clorus's Camp. Crocker, Edmund
Glastonbury
Pencil orientation lines can be seen around the edges of this drawing. An arrow protruding from Wells indicates the link-point between this and another drawing. The flat lands of Burtle Heath and Kings Sedge Moor occupy half the drawing. Field boundaries and the manmade drainage system are recorded. Toll gates are marked 'TG' along the main turnpike road from Shepton Mallet to Somerton, which forms the edge of the drawing.
Map of Hampshire, including the Isle of Wight, 3
1 Blatt : 53 x 68 cm s.n.
Cirencester(002OSD000000020U00118000)
1 : 31680 This drawing covers the counties of Gloucestershire, Oxfordshire and Wiltshire, with their boundaries indicated by pecked lines. The Roman road to Bath is tinted yellow to highlight it as a major communication route. A dotted line leading from Sapperton indicates the Sapperton Tunnel, which was opened in 1789. Linked to the Thames and Severn Canal, it was, at that time, the longest tunnel in England. The Sapperton Tunnel enabled boats carry coal cheaply to Cirencester from mines in the north and west. Several trigonometrical points are marked by dots within circles. These were points from which the surveyor took angular measurements to determine the relative locations of prominent features of the landscape. Metcalf, Edward B.