Maps of South Hams

delineation of the strata of England and Wales, with part of Scotland
1 : 320000 Blatt 12 Smith, William Cary
1) I.O. ''Plymouth'', uit: Carte géologique de France
1 : 500000 Annotatie: Voor aanwezige bladen zie bladoverzicht [S.l : s.n.]
South west coast of England from Exeter to Land's End, 1539-40
This is a map of the south-west coast of England, from Exeter to Land’s End. It dates from 1539-40 and its creation can be imputed to the threat of invasion which became probable in 1538 after a peace treaty was signed by Francis I of France and Charles V, Holy Roman Emperor and King of Spain. England and France were ancient enemies and the Catholic Charles V, nephew of Catherine of Aragon, was angered by Henry VIII’s decision to divorce her. Henry’s dissolution of the monasteries provided him with enormous wealth with which he was able to commission surveys of the vulnerable coastline and build defence fortifications. This map is the result of the order sent out by Thomas Cromwell in 1539 for the coasts to be surveyed by local people. These surveys, which were often just sketches or even text, were sent to London and in Greenwich they were edited, compiled and copied out for presentation to the King, who displayed them in Whitehall. The style of the map is pictorial with details such as ships, town views and fortifications shown in accurate detail. However, it contains vital practical information such as the state of defences and the distance between points along the coast and measurements at sea. Measurements at sea appear to be the estimated distance at which the navigator could discern features of the coastline. These are given in Dutch kennings probably due to the fact that the draftsmen in Greenwich included Flemish artists. The purpose of the map was to indicates, as if from the viewpoint of an invader, where landings could be made. Therefore, the cliffs, where landings would have been impossible are foreshortened, while the sandy beaches, where landings would have been easy are exaggerated in size. The sites for possible forts were then added to the map. The annotations on this map were made in about 1541 and record the state of fortifications, annotating made’ or not made’ over several fortification and half made’ over St Mawes Castle. Although this map contains measurements for use by sailors it is very unlikely that it would ever have been used at sea as it is almost 10 feet long and thus highly impractical for use within the confined space onboard ship. Thomas Cromwell
Cornubia. sive Cornwallia. [Karte], in: Novus atlas absolutissimus, Bd. 7, S. 206.
1 Karte aus Atlas Janssonius Offizin
Sheets 1-2. (Cary's England, Wales, and Scotland).
1 : 360000 Cary, John, ca. 1754-1835
Cornubia. sive Cornwallia [Karte], in: Theatrum orbis terrarum, sive, Atlas novus, Bd. 4, S. 125.
1 Karte aus Atlas Blaeu, Joan Blaeu, Willem Janszoon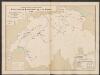
Cornubia. sive Cornwallia. [Karte], in: Le théâtre du monde, ou, Nouvel atlas contenant les chartes et descriptions de tous les païs de la terre, Bd. 4, S. 111.
1 Karte aus Atlas Blaeu, Willem Janszoon und Blaeu, Joan Blaeu, Willem Janszoon
Cornubia. sive Cornwallia. [Karte], in: Theatrum orbis terrarum, sive, Atlas novus, Bd. 4, S. 125.
1 Karte aus Atlas Blaeu, Joan Blaeu, Willem Janszoon
CORNVBIA | sive | CORNWALLIA.
[Amsterdam : Joan Blaeu]
PROMONTORIUM HOC IN MARE PROYECTUM CORNUBIA DICITUR Sheet 5
This map of Cornwall is from the 1583 edition of the Saxton atlas of England and Wales.This atlas was first published as a whole in 1579. It consists of 35 coloured maps depicting the counties of England and Wales. The atlas is of great significance to British cartography as it set a standard of cartographic representation in Britain and the maps remained the basis for English county mapping, with few exceptions, until after 1750. During the reign of Elizabeth I map use became more common, with many government matters referring to increasingly accurate maps with consistent scales and symbols, made possible by advances in surveying techniques. Illustrating the increasing used of maps in government matters, Lord Burghley, Elizabeth I’s Secretary of State, who had been determined to have England and Wales mapped in detail from the 1550s, selected the cartographer Christopher Saxton to produce a detailed and consistent survey of the country. The financier of the project was Thomas Seckford Master of Requests at the Court of Elizabeth I, whose arms appear, along with the royal crest, on each map. Saxton, Christopher Ryther, Augustine
PROMONTORIUM HOC IN MARE PROYECTUM CORNUBIA DICITUR f.8
This map of Cornwall is by Christopher Saxton. It forms part of an atlas that belonged to William Cecil Lord Burghley, Elizabeth I’s Secretary of State. Burghley used this atlas to illustrate domestic matters. This map is actually a proof copy of one which forms part of Christopher Saxton’s Atlas of England and Wales. This atlas was first published as a whole in 1579. It consists of 35 coloured maps depicting the counties of England and Wales. The atlas is of great significance to British cartography as it set a standard of cartographic representation in Britain and the maps remained the basis for English county mapping, with few exceptions, until after 1750. During the reign of Elizabeth I, map use became more common, with many government matters referring to increasingly accurate maps with consistent scales and symbols, made possible by advances in surveying techniques. This map was produced under the patronage of Thomas Seckford, a Master of Requests to Elizabeth I, who had commissioned Saxton’s atlas of county maps, a project overseen by Lord Burghley, Secretary of State, whose administration increasingly involved the use of maps. Here an annotation, probably by Lord Burghley, can be seen in the addition of a bridge at Truro. Such an addition is typical of Lord Burghley who was concerned with communication routes, such as roads and bridges, which were vital to the defence of the country, a central consideration during the reign of Elizabeth I, during which England was continually under threat. Saxton, Christopher Antver, Lenaert Terwoort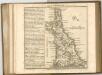

Cornvbia sive Cornwallia
1 Karte : Kupferdruck ; 38 x 48 cm Blaeu Joan Blaeu
Cornubia sive Cornwallia
1 : 170000 Amstelodami : excudebat Ioannes Ianssonius
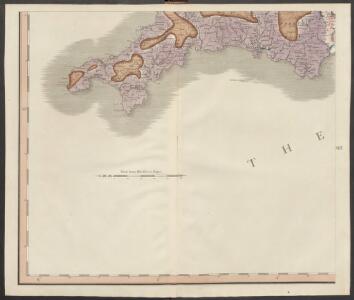
Cornwall, Sheet 37 - Bartholomew's "Half Inch to the Mile Maps" of England & Wales
1 : 126720 Topographic maps Bartholomew, John George John Bartholomew & Co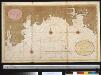
Een gedeelte van het Kanaal vant eijland Bun tot de R. van Vaalmouth
England Gerard van Keulen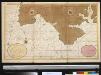
Een gedeelte van het Kanaal van de rivier van Falmouth tot aen Engelands Eijnde
England Gerard van Keulen
Lands End - OS One-Inch Map
1 : 63360 Topographic maps Ordnance Survey Ordnance Survey
Truro and Falmouth - OS One-Inch Map
1 : 63360 Topographic maps Ordnance Survey Ordnance Survey
Plymouth - OS One-Inch Map
1 : 63360 Topographic maps Ordnance Survey Ordnance Survey
Torquay - OS One-Inch Map
1 : 63360 Topographic maps Ordnance Survey Ordnance Survey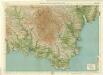
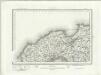
South Devon, Sheet 36 - Bartholomew's "Half Inch to the Mile Maps" of England & Wales
1 : 126720 Topographic maps Bartholomew, John George John Bartholomew & Co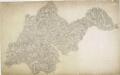
Helston, Cornwall
This drawing is attributed to Robert Dawson (1771-1860), a first-class Royal Military Draughtsman and Surveyor. He was also an influential teacher at the Tower of London Drawing Room, where he had been employed since the age of eighteen. The map is oriented unconventionally, with north to the left rather than at the top. Consequently, Lizard Head, the southernmost point of Great Britain, lies to the right of the plan. The boundaries of the area surveyed are coastal from Porthleven to Falmouth Bay, but at Lower Trenoweth they leave the coastline and follow the roads inland. The word 'flag' is written in several places (the tip of the Lizard, for example) to mark points between which Dawson took angular measurements to pinpoint topographical features. Similarly Signal Staff points are noted around the coast at Black Head and below Mullion Island. Helston was a tin-mining town. Copper and tin mines in the area are indicated by symbols. Dawson, Robert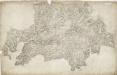
Grampound, Cornwall
1 : 31680 Military batteries are marked along the coastline in this drawing. The profusion of defensive castles in this area is testimony to the perceived vulnerability of coastal regions. Red blocks indicate individual structures within the complex of Pendennis Castle, built by Henry VIII after his divorce from Catherine of Aragon aroused the hostility of Catholic France and Spain. The nearby castle of St Mawes acted as a seaward deterrent, protecting the anchorage of Falmouth. Half Moon Battery is indicated, as are signal seats along the extreme edge of the coast. Budgen, Charles
Land's End, Cornwall
On this plan of a section of the English south coast, tin and copper mines ('wheals') are indicated by lines of dots arranged in blocks. To the left of Sancred, the ancient fort of Caer Bran is denoted by a circular marking, even though systematic recording of archaeological sites did not become obligatory until 1816. The drawing is considerably worn around the edges, rendering the cartographic detail almost illegible. Long Ships lighthouse is faintly discernible. Colour washes have faded and margins have been trimmed. Hewitt, John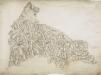
St. Columb Major, Cornwall
1 : 31680 .This drawing is orientated toward the south-east. On its reverse, obscured by backing material, is a triangulation diagram used to plot locations accurately. Tin and copper mines are marked, and a key to the symbols used to distinguish them is given at the bottom of the drawing. ."Harmony Cot" is marked as the birthplace of the portrait painter, John Opie (1761-1807). The inclusion of such information seems at odds with the Survey's military emphasis, but it does reflect the interests and training of the draughtsmen, many of whom were professional artists. To the north of St Columb Major lies the ancient monument known as the Nine Maidens, symbolised by a drawing of stones. A dot, annotated "point", appears in the bottom left hand corner of the map. This is probably the coastal station at Trevose Head, a base for the measurement of angles of elevation. Dawson, Robert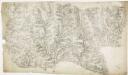
Liskeard, Cornwall
This drawing is mentioned in the Ordnance Survey Letter Book. Folio 91 records that the drawing was returned to the Tower from the Quartermaster General's Office. The circular hole in the top right-hand corner indicates that an 'Ordnance Office Copy' blind stamp has been removed. Relief is a dominant feature of this drawing, recorded by shading and interlining ('hachuring'). Trigonometrical altitudes are also recorded. Coniferous and deciduous trees are distinguished pictorially. Although recording archaeological sites was not obligatory until 1816, many draughtsmen noted these prior to this. Here an 'Ancient Fort' is shown in Trelawn, while an ancient earth bank called Giant's Hedge, possibly the boundary of a petty kingdom, is marked by a yellow line. Dawson, Robert
A coloured chart of Falmouth Haven and the river Fal up to Truro; drawn 1590-1600
This sixteenth century drawing shows the layout of Falmouth harbour in Cornwall. It must have been drawn after the completion of Pendennis and St Mawes Castles in the 1540’s as these are depicted, although in a fanciful manner bearing little resemblance to the real structures. These castles were part of a defensive chain built by Henry VIII after a peace treaty was signed by Francis I of France and Charles V, Holy Roman Emperor and King of Spain in 1538, making invasion of England probable. England and France were ancient enemies and the catholic Charles V, nephew of Catherine of Aragon, was angered by Henry VIII’s decision to divorce her. Henry’s dissolution of the monasteries provided him with enormous wealth with which he was able to commission surveys of the vulnerable coastline and build defence fortifications. This drawing was probably executed to provide a record of this vulnerable area of the coast for defensive purposes. It is possible that this drawing may date from 1598 – 1599 when the military engineer Paul Ivey was responsible for strengthening St Mawes and Pendennis following the 1597 scare that the Spanish might direct an armada towards Falmouth Haven. Pictorial depiction’s of castles, ships and sea monsters feature on this map which verges on the fanciful in its details, the naval battle in the top left is simply an embellishment. In the bottom left hand corner is a clover leaf pattern that is in fact an accurate ground plan of St Mawes Castle. A later annotator may have drawn this in an attempt to correct the picturesque inaccuracy of its depiction in this drawing.
Penzance (Hills) - OS One-Inch Revised New Series
1 : 63360 Topographic maps Ordnance Survey Ordnance Survey