Maps of Devon
Cornwall XVI.SW - OS Six-Inch Map
1 : 10560 Topographic maps Ordnance Survey Ordnance Survey
Cornwall XVI.SW - OS Six-Inch Map
1 : 10560 Topographic maps Ordnance Survey Ordnance Survey
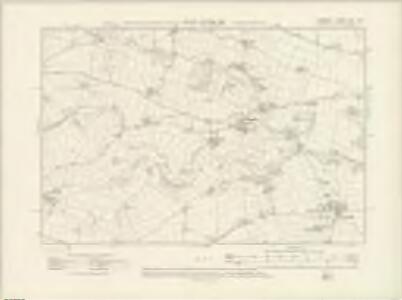
Cornwall XVI.10 (includes: Lewannick; South Petherwin; St Thomas The Apostle Rural; Trewen) - 25 Inch Map
1 : 2500 Topographic maps Ordnance Survey Ordnance Survey
Cornwall XVI.10 (includes: Lewannick; South Petherwin; St Thomas The Apostle Rural; Trewen) - 25 Inch Map
1 : 2500 Topographic maps Ordnance Survey Ordnance Survey
Cornwall XVI.9 (includes: Altarnun; Laneast; Lewannick; Trewen) - 25 Inch Map
1 : 2500 Topographic maps Ordnance Survey Ordnance Survey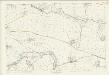
Cornwall XVI.9 (includes: Altarnun; Laneast; Lewannick; Trewen) - 25 Inch Map
1 : 2500 Topographic maps Ordnance Survey Ordnance Survey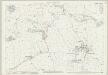
Cornwall XVI.14 (includes: Lewannick; South Petherwin) - 25 Inch Map
1 : 2500 Topographic maps Ordnance Survey Ordnance Survey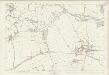
Cornwall XVI.14 (includes: Lewannick; South Petherwin) - 25 Inch Map
1 : 2500 Topographic maps Ordnance Survey Ordnance Survey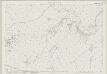
Cornwall XVI.13 (includes: Altarnun; Lewannick) - 25 Inch Map
1 : 2500 Topographic maps Ordnance Survey Ordnance Survey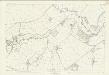
Cornwall XVI.13 (includes: Altarnun; Lewannick) - 25 Inch Map
1 : 2500 Topographic maps Ordnance Survey Ordnance Survey
SX28 - OS 1:25,000 Provisional Series Map
1 : 25000 Topographic maps Ordnance Survey Ordnance Survey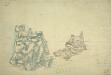
Launceston, Cornwall
This drawing of the area around Launceston in Cornwall displays several of the,characteristic techniques,of draughtsman, Robert Dawson (1771-1860).,He used dense colour washes and short, hatched lines pointing in the direction of slopes ('hachures') to,represent relief,,combining them,with numerical estimates of relative altitude.,Magnetic north is decoratively indicated just off the coast at Tintagell Castle, the legendary birthplace of King Arthur, to the central left of the picture.,Launceston Castle is,shown at the most easterly point of the smaller inland landmass.,Slate quarries are marked at Delaboule, in the centre of the left landmass, and Tresmarrow, in the centre of the right.,Pencil lines are clearly visible, recording the,angles between fixed points used for triangulation.,The paper carries an Edmeads,,amp; Pine watermark. Dawson, Robert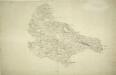
Launceston, Cornwall 1
Once the capital of Cornwall, Launceston is represented here by red blocks, each indicating a stone building., The castle dates from Norman times and was one of the greatest strongholds of the Earls of Cornwall, controlling the main entry route into the county., The road leading to Trevadlack Cross is physically,marked on the map,by a series of pin-holes., This means the draughtsman used measuring dividers to plot the exact course of the road., Recording archaeological sites did not become obligatory until 1816, but,many draughtsmen included them before then,out of personal interest., Here,,a set of concentric circles at the top of the map represents such a site, called,'Giant's Grave'., Hewitt, John
South Petherwin, Cornwall
A triangulation diagram covers this whole drawing. This was used to plot the location of significant features around which other topographical details could be added., Trigonometric altitudes are recorded at the summit of inclines, while short disconnected lines are drawn in blue watercolour to represent relief - a technique known as 'hachuring'.,Several archaeological sites are recorded on this drawing, although this did not become obligatory until 1816.,In the lower section of the map to the left of Upton, a darkened triangular point is marked,'Cheese Wring'.,Below this is a stone circle named 'The Hurlers'.,Field boundaries are marked, with darker lines indicating the division between cultivated and uncultivated land.,A table of figures appears in pencil,to the lower right of the drawing.,Sealing wax is apparent on the reverse.,The paper is watermarked W. ELGAR 1796., Dawson, Robert
Tavistock (Hills) - OS One-Inch Revised New Series
1 : 63360 Topographic maps Ordnance Survey Ordnance Survey
Tavistock (Outline) - OS One-Inch Revised New Series
1 : 63360 Topographic maps Ordnance Survey Ordnance Survey
Camelford, Cornwall (002OSD000000001U00009000)
Royal Military Draughtsmen and Surveyors were listed as first-class or second-class by the Tower of London Drawing Room according to the quality of their work. Robert Dawson, the draughtsman of this map, was an influential teacher at the Tower and rated first-class, while Henry Stevens, the surveyor, was rated only second-class.The orientation of this map does not have north at the top. Hence, the coastal boundary from Widemouth Bay south to Tintagel Castle runs from left to right along the bottom of the drawing. A faded blue-green wash indicates water. Brown Willy, the highest point in Cornwall, is shown on the northern edge of Bodmin Moor to the top right of the inland boundary. A turnpike road, coloured ochre yellow, runs from Launceston to Camelford. One side of the road is thickened and miles appear alongside in figures. The close attention given to communication routes highlights the military intent of these studies. At the same time, archaeological features and antiquities are also noted, reflecting the particular interests of individual surveyors or draughtsmen. In this instance, manganese mines are marked. Stevens, Henry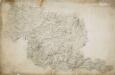
Bodmin, Cornwall
Bodmin Moor features on this drawing. The relative relief of the land is indicated by a combination of shading, brushwork interlining ('hachuring') and trigonometrical altitudes noted at the summit of inclines. Tin and copper mines are indicated by different symbols, and archaeological sites are shown by various yellow-tinted circular formations. The drawing spans three conjoined sheets. The 'Ordnance Office Copy' blind stamp can be seen in the top left corner. Dawson, Robert
Bodmin and Launceston - OS One-Inch Map
1 : 63360 Topographic maps Ordnance Survey Ordnance Survey
Bude - OS One-Inch Map
1 : 63360 Topographic maps Ordnance Survey Ordnance Survey
South Devon, Sheet 36 - Bartholomew's "Half Inch to the Mile Maps" of England & Wales
1 : 126720 Topographic maps Bartholomew, John George John Bartholomew & Co
Cornwall, Sheet 37 - Bartholomew's "Half Inch to the Mile Maps" of England & Wales
1 : 126720 Topographic maps Bartholomew, John George John Bartholomew & Co
Sheets 11-12. (Cary's England, Wales, and Scotland).
1 : 360000 Cary, John, ca. 1754-1835
Devonshire
1 : 640000 Devon (Anglie) Hall, Sid. by Chapman & Hall
Devoniae descriptio = The description of Devon-Shire
1 : 180000 Amstelodami : apud Joannem Janssonium
DEVONIAE COMITAT
This map of Devon is from the 1583 edition of the Saxton atlas of England and Wales. This atlas was first published as a whole in 1579. It consists of 35 coloured maps depicting the counties of England and Wales. The atlas is of great significance to British cartography as it set a standard of cartographic representation in Britain and the maps remained the basis for English county mapping, with few exceptions, until after 1750. During the reign of Elizabeth I map use became more common, with many government matters referring to increasingly accurate maps with consistent scales and symbols, made possible by advances in surveying techniques. Illustrating the increasing used of maps in government matters, Lord Burghley, Elizabeth I’s Secretary of State, who had been determined to have England and Wales mapped in detail from the 1550s, selected the cartographer Christopher Saxton to produce a detailed and consistent survey of the country. The financier of the project was Thomas Seckford Master of Requests at the Court of Elizabeth I, whose arms appear, along with the royal crest, on each map. The decorative scale bar houses the name of Saxton and of the Flemish engraver Remigius Hogenberg who prepared the copper plate for this map. This is the only map in the atlas that features a compass rose as well as the cardinal points in the borders, seeming to indicate the Devon has been turned slightly clockwise to fit the plate. Two ships engaging in battle are depicted off the coast of Plymouth, perhaps making reference to the vulnerability of this section of south coast and the location of naval bases. Saxton, Christopher Ryther, Augustine
DEVONIAE COMOTAT
This map of Devon is by Christopher Saxton and dates from 1575. It forms part of an atlas that belonged to William Cecil Lord Burghley, Secretary of State to Elizabeth I. Burghley used this atlas to illustrate domestic matters. This map is actually a proof copy of one which forms part of Christopher Saxton’s Atlas of England and Wales. This atlas was first published as a whole in 1579. It consists of 35 coloured maps depicting the counties of England and Wales. The atlas is of great significance to British cartography as it set a standard of cartographic representation in Britain and the maps remained the basis for English county mapping, with few exceptions, until after 1750. During the reign of Elizabeth I map use became more common, with many government matters referring to increasingly accurate maps with consistent scales and symbols, made possible by advances in surveying techniques. This map was produced under the patronage of Thomas Seckford, a Master of Requests to Elizabeth I, who had commissioned Saxton’s atlas of county maps, a project overseen by Lord Burghley, Secretary of State, whose administration increasingly involved the use of maps. This map is interesting as there are several notes in the margins. In the lower right hand margin: 'A Note of hir maties Store of Ordonnaunce, powder and match, lead,&c.,remayningin ye L. Lieutenauntes, &c. hands'. In the upper right hand margin 'A Note what powder and match was appointed to be kept in store in every corporate towne'. In the left hand margin 'A Breef Note of ye places of Descent. . . yt are most daungerous and require greatest regard and assistaunce'. These annotations were most probably made by an assistant of Lord Burghley’s, and show the concern felt about coastal areas in the face of the threat from Spain which culminated in 1588 with the events of the Spanish Armada. Saxton, Christopher Hogenbergius, Remigius
A new map of the County of Devon
London : C. Smith
Cornvbia sive Cornwallia
1 Karte : Kupferdruck ; 38 x 48 cm Blaeu Joan Blaeu